Uncertainty and Diminished Demand Continue to Weigh on Prospects for Steel & Aluminum Market Recovery

In this article, we take a look at the course of Steel and Aluminum industry trends leading up to the COVID-19 crisis as well as the factors that are now impacting those industries, and the variables that stand to either speed or slow their paths to recovery.
Throughout much of 2019, steel market prices experienced a notable downward trend. With the onset of the COVID-19 pandemic in early 2020, that trend accelerated as demand for steel from most sectors sharply declined. Market prices stabilized in the June to August period and then increased in September to Pre-COVID levels, with the outlook for Q4 2020 and beyond still unclear. In the five months ended August 2020, decreasing demand and market prices negatively affected the gross margins of producers, distributors and manufacturers dealing in steel products. As we look ahead toward a period where the economy demonstrates a discernible trend of expansion and demand increases, we would expect to see well-run companies consuming older- and higher-cost inventories purchased in prior periods alongside lower-cost inventory purchased more recently. This, hopefully, will bring about a return to sales margins more in-line with pre-COVID levels.
The Steel Industry
The Three “Legs” of the steel industry are Construction, Transportation and Energy. The COVID-19 pandemic initially brought automobile production to a standstill and significantly decreased the need for rail cars, trucks, truck trailer, and other transport related goods. Construction, which has longer planning and completion cycles, was initially less effected but the longer-term implications there remain to be seen. From an energy perspective, oil and gas markets were already in a downward slide before the crisis ever began. COVID-related shutdowns of industrial facilities, schools and office buildings, combined with a mild winter, decreased demand for oil and gas. This, in turn, reduced exploration and the need for steel pipe, drilling equipment and other goods. So, where are we now and where is the industry going?
Construction
Record-low interest rates continue to provide a strong incentive for home ownership, and the continuation of COVID-19 restrictions for the foreseeable future may further entice people out of apartments and into larger living spaces, increasing demand for single family homes. Commercial and retail construction has a longer planning and building cycle and many of the projects started or completed since the start of the pandemic were probably begun long ago. Given these considerations, the real question is: how will COVID-19 affect future construction of retail and office space?
Privately-Owned Housing Units Authorized By Building Permits in August were at a seasonally adjusted annual rate of 1,470,000. This is 0.9 percent below the revised July rate of 1,483,000 and 0.1 percent below the August 2019 rate of 1,471,000.
Privately-Owned Housing Starts in August were at a seasonally adjusted annual rate of 1,416,000. This is 5.1 percent below the revised July estimate of 1,492,000, but 2.8 percent above the August 2019 rate of 1,377,000.
Total Construction Spending during July was estimated at a seasonally adjusted annual rate of $1,364.6 billion, 0.1 percent above the revised June estimate of $1,362.8 billion. The July figure is 0.1 percent below the July 2019 estimate of $1,366.0 billion. During the first seven months of this year, construction spending amounted to $792.6 billion, 4.0 percent above the $761.9 billion for the same period in 2019.
Transportation
● Domestic production of automobiles and light trucks topped 17 million units in 2019 and prior to the onset of COVID-19, 2020 was projected to approximate the same production rate. Virtually all auto production ceased in March and April 2020 before coming back online in April and May. Current estimates call for the production of 12.5 million to 13.5 million units in 2020; a reduction from earlier estimates of as much as four million vehicles.
● Production of heavy truck and other vehicles was similarly disrupted in the short term. Longer term, demand for construction and over-the-road vehicles will likely be negatively affected by COVID-19-related demand reductions.
● Reduced capacity auto restarts took place in late May/early June 2020 and in July, production increased for the first time since the start of the pandemic to 2.63 million units from only 1.72 million units the month prior.
Energy
● In the period leading up to the pandemic, oil and gas prices experienced a downward trend as a result of worldwide over-supply, the Saudi/Russia price war, competition from renewable energy sources, the increased efficiency of vehicles and appliances, as well as myriad other conservation efforts. This decreased demand, in turn, resulted in less oil and gas exploration, fewer pipeline miles, and less need for production equipment.
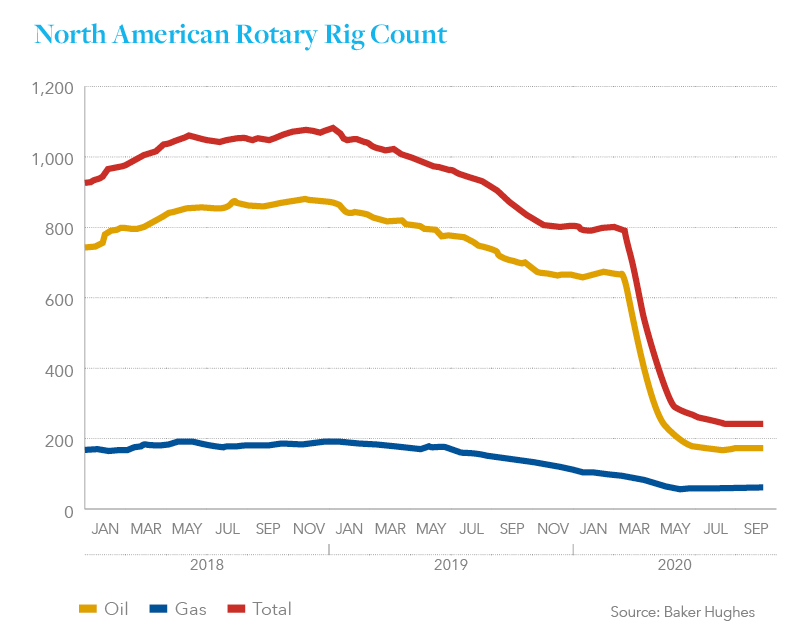
● In North America the Baker Hughes Rig Count serves as a barometer for the industry as a whole, tracking the number of operational oil and gas rigs across both the U.S. and Canada. From the period January 2019 to January 2020, active rigs in the two countries decreased from a count of 1,075 to 796, dropping precipitously from there to just 266 by the end of June 2020 and approximating 250 by mid-September.
The Calm Before the Storm
In March of 2018, almost precisely two years prior to the onslaught of the pandemic in the U.S., the Trump administration announced its intention to impose a 25% tariff on steel and a 10% tariff on aluminum imports under Section 232 of the Trade Expansion Act of 1962. The tariffs were an intentionally broad-sweeping step implemented to save the faltering domestic steel and aluminum industries, predicated on the determination that the then existing tangled web of cyclical trade actions simply was not working. The tariffs were put in place with the tacit understanding between the Trump administration and the major steel and aluminum producers that the implementation of tariffs would lead to the restart of idled facilities and job creation.
By the start of March 2020, before COVID-19 cases escalated in the U.S. and a pandemic had been declared, the Section 232 tariffs had essentially run their course, with their impact largely minimized through the various negotiations and treaties that ensued following their implementation. We can track the path
of these developments as follows:
● Steel market prices increased rapidly after the tariffs were announced, decreased, then plateaued at, or near, pre-tariff levels by the first quarter of 2019.
● Certain steel production facilities were restarted or expanded production following the 232 tariffs, but the industry continued to rationalize locations, shutting older inefficient locations while upgrading and expanding production at more modern facilities.
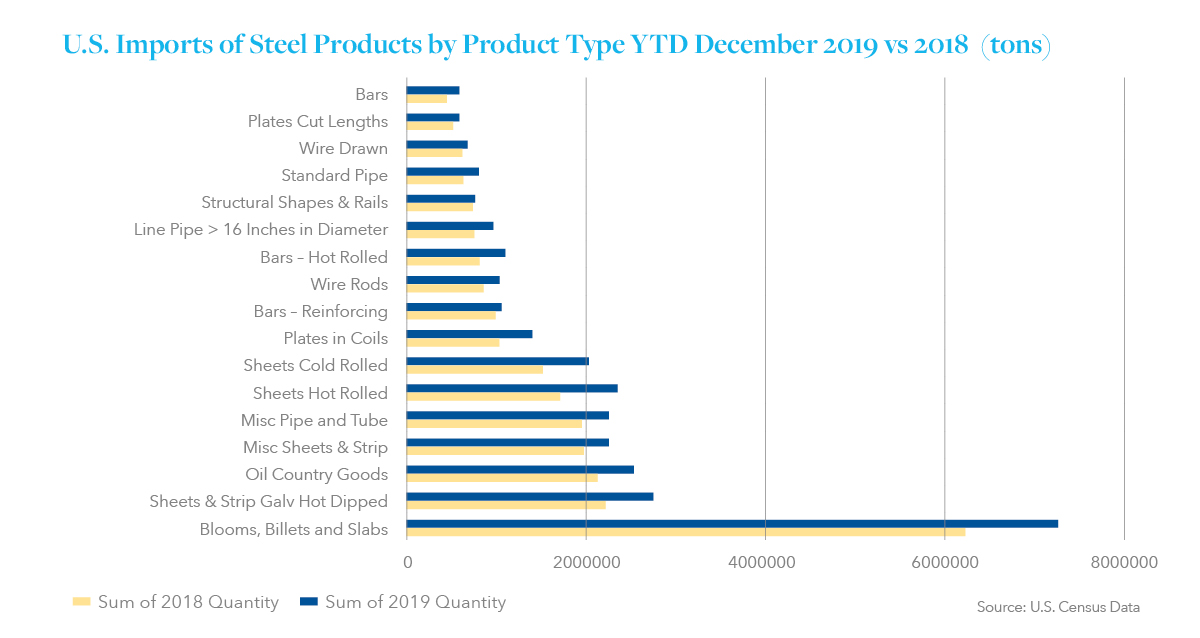
● The quantity of imported steel products decreased from 33.7 million tons in 2018 to 27.9 million tons in 2019.
● Domestic steel mill shipments of finished products totaled 96.2 million net tons in 2019, up 0.9 percent compared to 2018.
● Domestic demand was negatively affected by destocking at steel service and distribution centers totaling almost a million tons in 2019. Service centers tend to reduce inventories when they believe prices are likely to trend downward or there is a likelihood of decreased demand.
● The USMCA replaced the NAFTA agreement resulting in changes in trade policy affecting steel and other goods and eliminating steel tariffs between the U.S., Mexico and Canada — two of three largest importers of steel products into the U.S.
● Other trade agreements eliminated tariffs against Brazil, South Korea and Argentina in exchange for quotas on the quantity of goods exported to the U.S. Limiting the inflow of certain products should make supply/demand factors more stable resulting in a more stable pricing market.
● A published report by ArcelorMittal estimates that 68% of the steel products originally subject to tariffs were no longer affected by the first quarter of 2019.
● At best the tariffs provided short-term relief, increasing both market prices and demand and allowing steelmakers to realign themselves for the future as the domestic steel industry continues to evolve.
● Domestic production of primary aluminum increased but worldwide aluminum market prices have decreased, hampering further expansion.
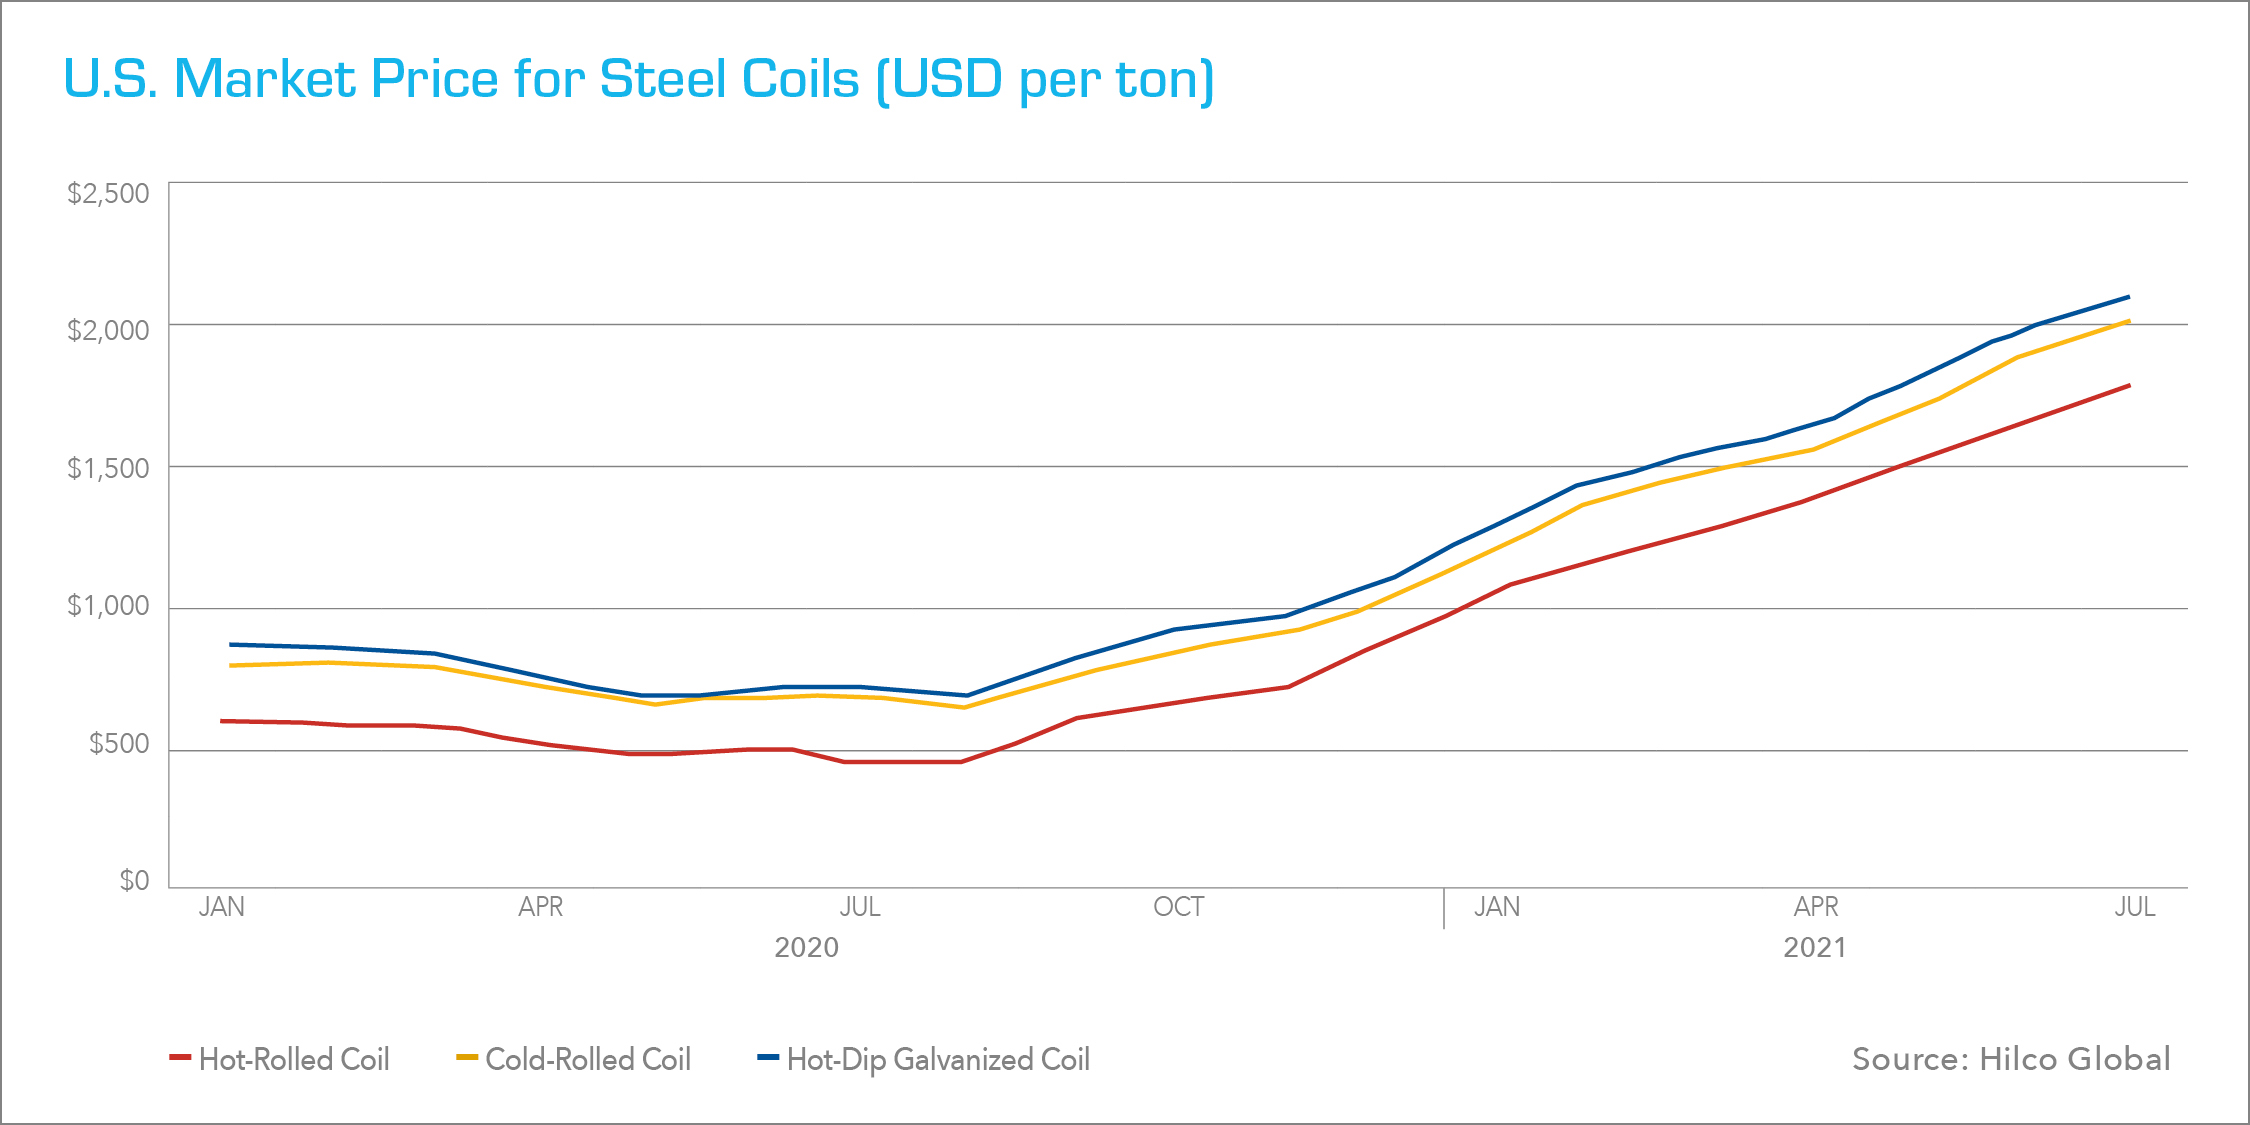
Market prices for steel coils are typically more volatile than other product types as shown in the chart below. After decreasing in the March to May 2020 period, prices stabilized and began to increase in July and August. In mid-September the producing mills announced a series of price increases that would return market pricing for most products to pre-COVID levels.
Market prices for other steel products; plate, rebar, structural tube and pipe followed similar trends. Increases after the imposition of tariffs were followed by decreases through the later part of 2018 and most of 2019. The market then stabilized for a period, after which it again decreased as the COVID-19 pandemic took effect.
Past Meets Present
In response to reduced demand, in early Q2 2020 the major steel producers announced a series of curtailments which idled nearly half of the domestic blast furnace fleet. By June and July most of those operations came back online, but others still remain idled indefinitely.
As we have outlined in previous Hilco updates, the U.S. steel industry is comprised of both fully-integrated mills using iron ore and blast furnaces to produce steel and “mini-mills” using electric arc furnaces to melt steel scrap to produce new steel. The last “new” fully integrated mill began casting operations in 1975 at Bethlehem Steel’s Burns Harbor, Indiana location, now operating as part of ArcelorMittal USA. In 1989 Nucor Steel established the first “mini-mill” in the U.S. in Crawfordsville, Indiana using electric arc furnaces and thin-slab casting equipment to process liquid steel directly into coiled products, eliminating many of the intermediate processing steps required by the older integrated mills.
In the flat rolled coil market, U.S. Steel, ArcelorMittal USA, AK Steel and several smaller companies continue to be primarily reliant on fully integrated mills. Nucor, Steel Dynamics, Inc., BlueScope Steel North America, and Big River Steel in Osceola, Arkansas operate only mini-mills. Big River Steel was established in 2014 and has a current capacity of 1.65 million tons of coiled steel production with additional facilities under construction that will double capacity to 3.3 million tons.
Since 1995, integrated steelmakers have been losing their dominant share of U.S. raw steel production to mini mills. According to a report published by ArcelorMittal, the movement of U.S. raw steel production from integrated mills to mini-mills continues, with blast furnace production share slowing from 72% in 1980 to 60% in 1995, and down to 32% by 2018. US steel mills have announced capital projects that will add 13.5 million tons of EAF flat-rolled steelmaking capacity at a cost of at least $6.3 billion over the next three years.
To better align itself with a changing market, U.S. Steel recently entered into agreements to purchase all of Big River Steel and, in December 2019, announced it would indefinitely idle its integrated Great Lakes Works near Detroit, Michigan. The Company is currently investing over $1 billion in an “endless casting” facility at its Mon Valley Works near Pittsburgh, bringing thin-slab casting technology— similar to that used by mini-mills – to its blast furnace-based steel mill.
So, is all of this bad or good news? It is certainly bad news for the those who may lose their jobs at Great Lakes (the author’s former employer), as well as for their suppliers and service providers. For the industry overall, however, it is probably good news, with about 3 million tons of capacity at a mill originally established in the 1930’s essentially being replaced by capacity at the Big River Steel mill that is just six years old. And the upgrade of the Mon Valley Works will make that facility competitive with both domestic mini mills and foreign mills, and likely extend that mill’s life.
Employing the newest technology means improved product quality and improved capability to produce the newest high strength steels while reducing overall cost. So, with the transition from older integrated mills to mini-mills or hybrid locations like the Mon Valley Works, the steel industry will no doubt be better positioned to compete in the future. However, because this type of improved efficiency often results in the need for fewer workers, and a relocation of certain jobs, transitions like these are likely to negatively impact certain companies as well as communities that have traditionally relied on the integrated steel industry for their livelihood.
Aluminum Industry
In July of 2018, Hilco predicted that tariffs on aluminum would have only a marginal impact on an industry already greatly reduced by worldwide competition. “Primary” aluminum refers to the products produced by the conversion of bauxite into pure aluminum in a two-step process. The first step chemically breaks down bauxite producing a semi-finished product referred to as alumina. In the second step, alumina is melted and converted into aluminum in large vessels referred to as pots in an operation that requires massive amounts of electricity.
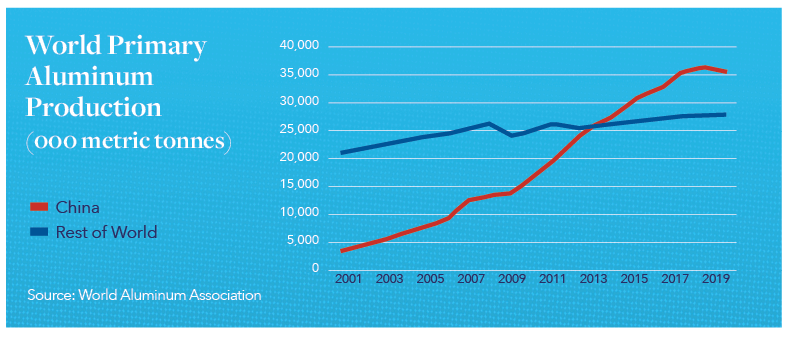
Historically, primary aluminum was produced where electrical power is inexpensive; in areas where hydroelectric power was available (Northern Canada), geothermal power (Iceland) or other low-cost locations. More recently, aluminum production has shifted to the Gulf States where low-cost electricity derived from natural gas is used, or in China and Russia where governmental entities may provide subsidized electricity. While U.S. primary aluminum output decreased from 3.7 million tonnes in 2000 to just over a million tonnes in 2019, aluminum production from China has increased significantly and since 2013 China has produced more than the rest of the world combined.
There are only two major primary aluminum producers in the U.S.; Alcoa and Century Aluminum, operating a handful of facilities in Kentucky and New York. As predicted, what primary smelting capacity remains, did increase output incrementally. Century Aluminum restarted certain idled properties and expanded output at others, which contributed to an increase in total domestic output from 891,000 metric tonnes in 2018 to 1,126,032 metric tonnes in 2019.
Hilco suggested back in 2018 that it was unlikely the then current, or any subsequent tariff, would bring about the construction of new domestic smelting capacity in the short term. With an uncertain market, massive capital investment in aluminum smelting plants with decades-long operation life is doubtful, and as predicted, no new facilities have been announced.
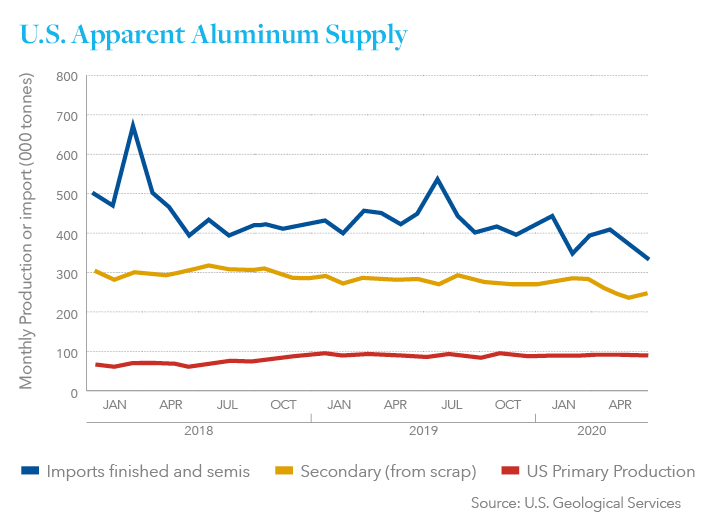
The domestic aluminum supply in the United States comes from domestically produced primary aluminum and secondary aluminum and imported finished and semi-finished goods. “Secondary” aluminum is produced by remelting factory generated aluminum scrap and obsolete aluminum scrap generated from recycling. Imported goods include semi-finished ingots and billets, bars, plates, coiled products and extrusions. While the production of primary aluminum has increased, domestically produced primary aluminum represents only about 10% of total domestic supply with the majority
of supply coming from imported products and secondary aluminum.
Worldwide aluminum prices are typically based on market prices reported in the London Metals Exchange (LME) and producers, consumers and investors use aluminum futures trading for hedging activities. Thus, aluminum is both a primary metal and a financial instrument, with market values based on factors other than supply and demand.
In the United States, market prices are typically based on three factors: 1) the LME cost of the metal itself; 2) the cost to convert aluminum ingots and other semi-finished goods into finished coils, plates and extrusions, and; 3) the Midwest Premium, which represents transportation, warehousing and other cost.
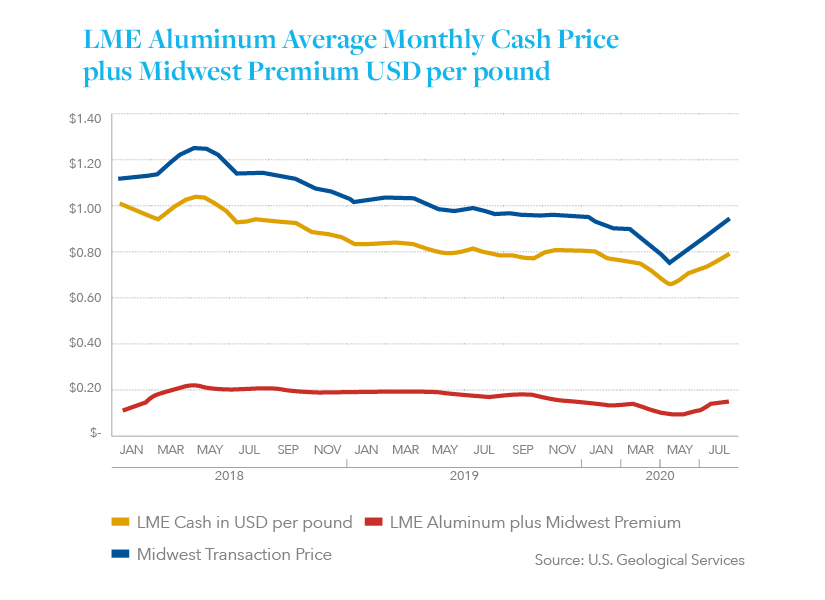
Prior to the Section 232 announcements in March 2018, aluminum market prices had trended upward. As shown in the chart below, the LME cash price of aluminum was $0.95 per pound in March 2018 and the Midwest Premium was $0.19. In March 2019, the LME cash price of aluminum was $0.77 per pound and the Midwest Premium was $0.14 per pound. The total Midwest Transaction Price, the sum of the LME and Midwest Premium, decreased from $1.14 per pound in March 2018, to $0.91 per pound in March 2019, making it more difficult for U.S. producers to sell their goods at a profit and discouraging further expansion. Like steel market prices, aluminum prices were negatively impacted by Covid-19 disruptions with the LME Aluminum and Midwest Premium prices decreasing to $0.66 per pound and $0.09 per pound, respectively in May 2020, before increasing in the June to September period to pre-COVID levels.
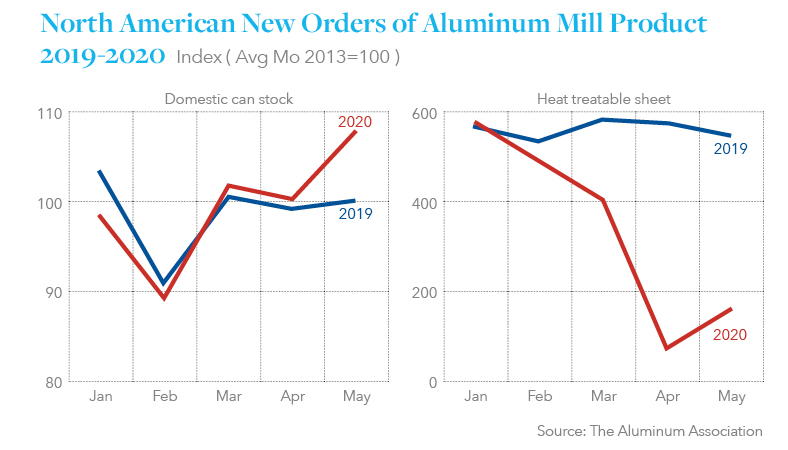
The largest end user of aluminum in the U.S. is the transportation sector, accounting for approximately 35% of overall aluminum consumption. As COVID-19 took hold domestically in March and April 2020, U.S. producers experienced a profound reduction in demand. As a result, they took steps to limit production and run at reduced capacity. According to the Aluminum Association, Total demand for aluminum mill products in the Month of May dropped 27.6% from the previous year, with foil orders down 30.3% and extruded products off 38.7 over the same period.
Reduced capacity auto restarts took place in late May/early June, but with production curtailed over the previous months, only 2.5 million vehicles remained in dealer stock at the end of June, down significantly from 3.5 million in mid-March and 3.2 million at the end of June 2019. The month of July 2020 finally saw production increase for the first time since the start of the pandemic to 2.63 million units from only 1.72 million units the month prior.
While much of the news has been negative, the U.S. beverage can industry has been a beneficiary of the restrictions imposed during the COVID-19 crisis. According to the Can Manufacturers Institute, canned beverage demand was actually up 8.3% in the first quarter, with canned beer increasing by 6.7% and soft drinks rising 9.3% as more people consumed in off-premise environments than perhaps ever before. As a result,
can makers are struggling to keep pace.
Outlook
As is now the case with a great many industries across the U.S. and globally, a timeline and clear path to recovery remain unclear. To be certain, from the current manufacturing recession to the precipitous fall of oil and gas prices, much is resting on the accelerated development, dissemination and proven effectiveness of a COVID-19 vaccine. With the airlines, among other large employers, now set to layoff thousands of workers once stimulus conditions are fulfilled, it can be expected that a continued period of high unemployment would further drive-down consumer confidence. The resulting impact on auto manufacturing which has only just restarted as well as residential construction, and the supply chains that feed each of these, would be deeply felt. That said, at the present time we are seeing momentum upward from market lows and with continued government stimulus that trend could begin to further accelerate if COVID-19 cases decrease in the months ahead, either as a result of a vaccine, other steps/policies, or a combination of these factors.
At Hilco, we are highly engaged with our clients, partners and numerous contacts across the industry during this trying time. The many conversations we are having daily and the engagements we are moving forward, continue to provide us with valuable insight and perspective that we welcome the opportunity to share with those of you who may have exposure across the Steel and Aluminum markets. With that in mind, please reach out to us with any questions or concerns you may have. We are here to help.
Hilco Valuation Teams
work in machinery, equipment and enterprise valuation for numerous companies in the metals and mining industry and thoroughly understand the unique dynamics of price volatility on manufacturers, distributors and fabricators. Hilco has unparalleled market trend data to assist our customers in ongoing assessment of how market forces drive recovery values. If you’re looking for a thorough process and a proven partner to help you gauge metals recovery values in your portfolio or your business, give us a call.


