Uncertainty and Diminished Demand Weigh on Prospects for Steel & Aluminum Market Recovery

In this article we discuss the decline of steel prices during 2022, explore factors contributing to this development, and topline considerations for lenders with portfolio exposure in the year ahead.
Market demand and prices for steel products collapsed following the onset of the COVID-19 Pandemic, soared to new highs in 2021 as the U.S and world economy expanded and then notably declined throughout 2022, ending the year with market prices still above pre-pandemic levels. As we enter Q2, we are observing:
- Strength in certain economic sectors continuing to benefit producers, distributors and manufacturers.
- Market prices trending upward, benefitting producers and distributors but increasing cost for manufacturers.
- Political and economic uncertainty adding risk to industrial inventories.
So what will drive the market this year?
Market Pricing
Historically, steel market prices tend to decline in Q4 each year as seasonal demand decreases. They then rebound in Q1. This is precisely what we have observed over the past several months as well. What remains to be seen is whether prices will peak in Q2 and level off in Q3, before once again decreasing in Q4 this year. It is worth noting that while prices for most steel products declined in 2022, that decline was gradual in nature. This could be a favorable signal for what we will see unfold as 2023 evolves.
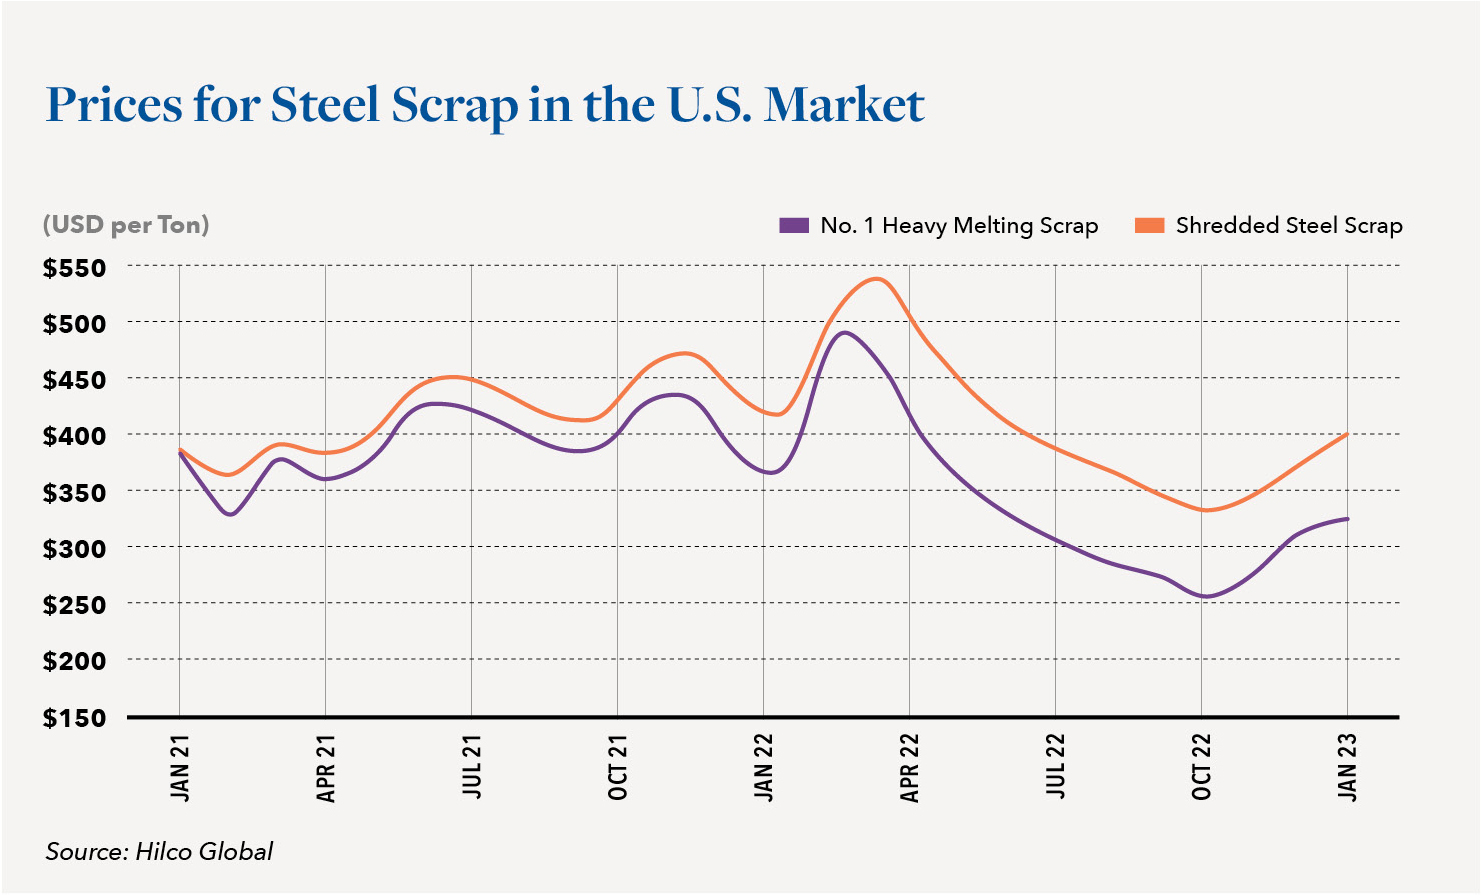
With about 80% of the steel made in the U.S. derived from recycled scrap, changes in scrap prices affect market prices for goods derived from the recycled raw material. In 2022, scrap prices trended downward after the midpoint of the year, increased again during Q4 and over the first two months of 2023. Market prices for shredded steel scrap were $400 per ton in June 2022, $350 in December 2022 and returned to near $400 again by early March 2023.
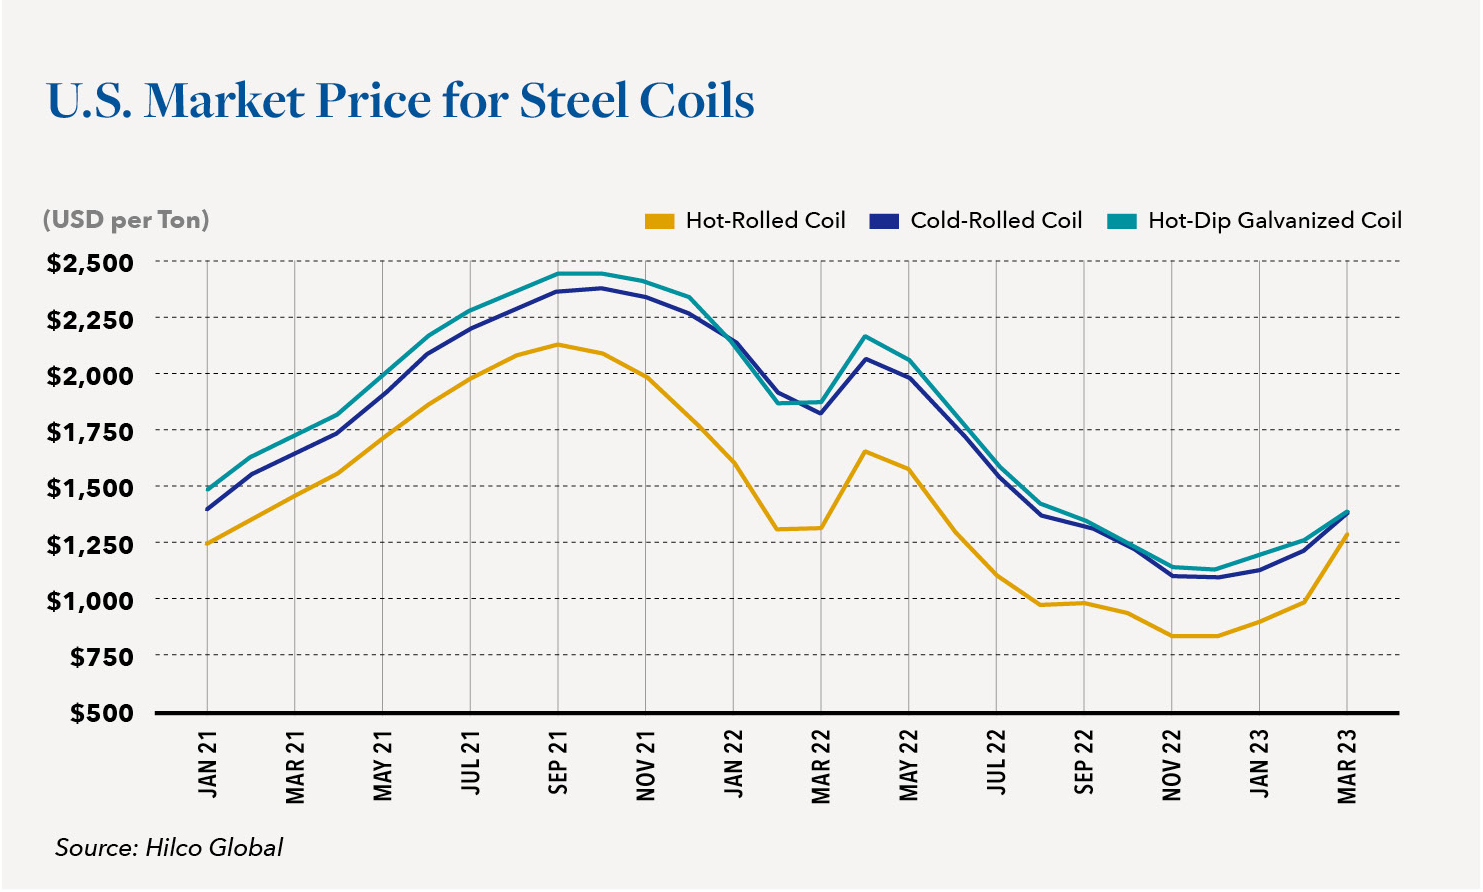
Market prices for steel coils are typically more volatile than other products. Exceeding expectations of a Q1 rebound this year, spot prices for hot roll coils soared from $760 per ton in December 2022 to as much as $1,200 per ton by the first week of March, as major steel producers announced multiple separate price increases of as much as $150 per ton, just weeks apart in February.
Steel mill utilization remained below 75% in the third and fourth quarters of 2022, limiting supply. That limited supply and strong demand brought about increased market prices.
Hot Rolled coil lead times have now increased from less than six weeks to approximately eight weeks. Cold rolled and galvanized lead times are eight-to-ten weeks. By the end of February 2023, mill capacity for coiled sheet products for March and April had already sold out.
Hot rolled coils are the substrate used to create cold rolled and galvanized coils and any increase in hot rolled coils immediately leads to similar increases for cold roll and galvanized coils. Cold rolled and galvanized coil spot market pricing rose sharply from less than $1,000 per ton in December 2022 to $1400 per ton in March 2023. Hot rolled coil is also the substrate for most pipe and tube products and those manufacturers typically increase prices immediately with each increase in coil prices.
In previous Hilco reports we suggested that the merger of AK Steel and ArcelorMittal’s U.S. operations into Cleveland Cliffs, the merger of Big River Steel into U.S. Steel, and other noteworthy mergers and acquisitions would likely lead to more discipline in terms of both production volume and pricing. Rather than sell steel at a loss or reduce prices to gain volume, this smaller pool of competitors does now seem content to sell fewer tons at higher prices.
Anticipating a lower price market in the second half of 2022, market participants allowed their inventories to decrease, so as we enter Q2 2023, there is minimal slack in the distribution chain. Distributors don’t want to be stuck holding last month’s higher-cost inventory when the replacement cost is lower. A stronger than expected economy, however, has brought about more demand than expected contributing to increasing market prices.
So, once again, we have what amounts to a perfect storm– a repeat of cycles seen multiple times in recent years. In 2021, the same factors led to soaring market prices as the economy recovered from the Pandemic and the supply chain was at a bare minimum.
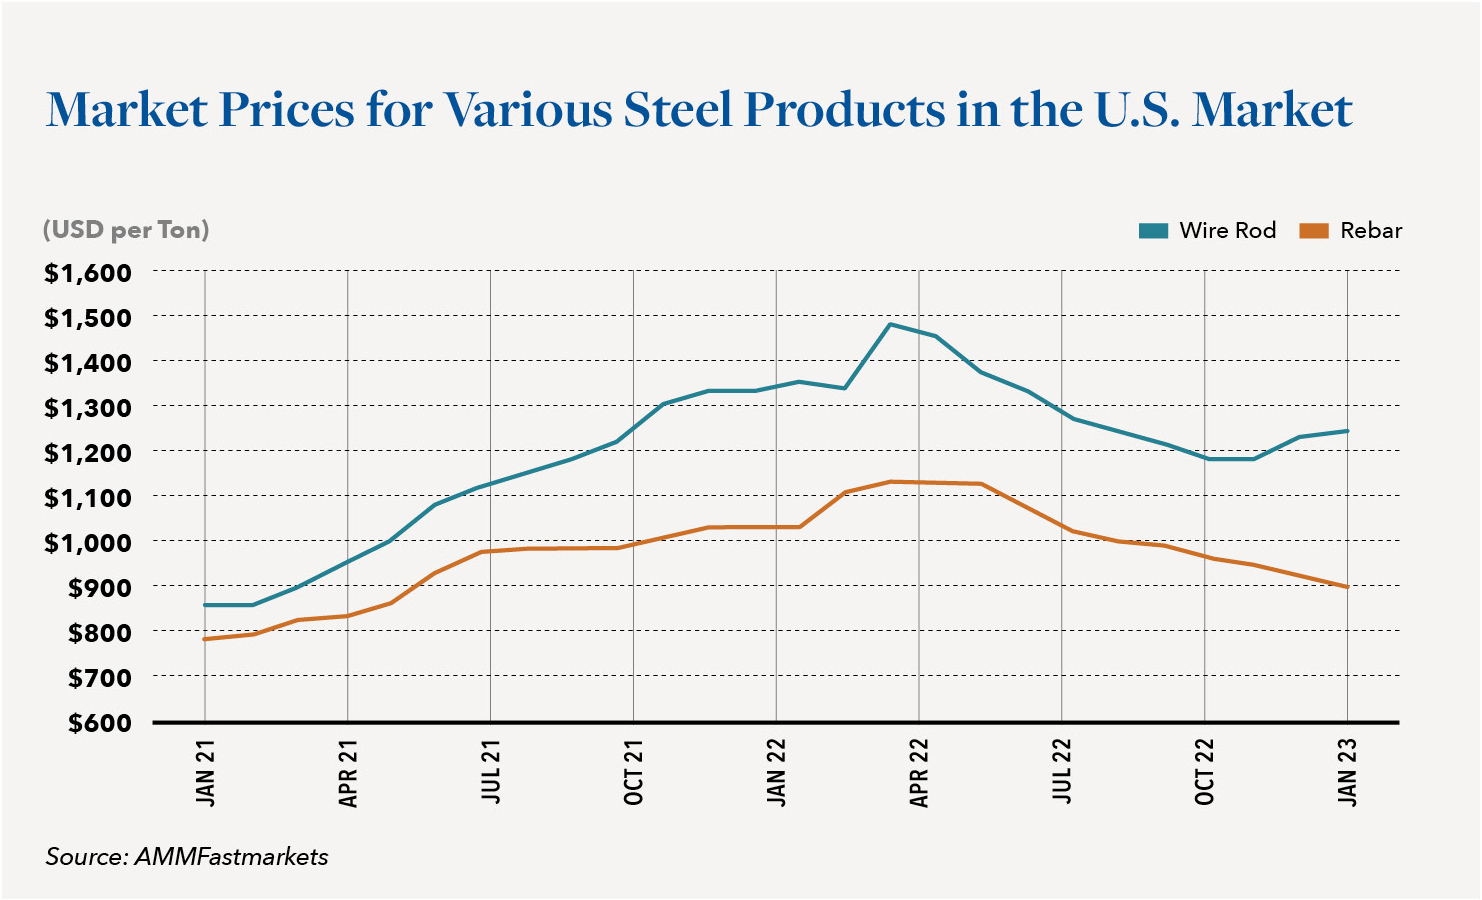
It is worth noting that while coil and tube prices have soared, market prices for rebar, steel rod, and other goods remained relatively flat throughout the fourth quarter and are just now (end of Q1/start of Q2 ’23) starting to show modest price increases. Demand and market prices for these types of plate and structural products tend to be more dependent on fiscal spending and capital spending by businesses.
The $1.2 trillion bipartisan Infrastructure Investment and Jobs Act (IIJA) was adopted by the U.S. Congress in November 2021, but only $185 billion (it’s hard to use the word only when describing $185 billion) had been allocated a year later. The remainder is waiting for projects to be reviewed and approved. While much of the money will eventually go to traditional infrastructure projects such as roads and bridges, portions are allocated to non-infrastructure “green” projects, electric vehicle infrastructure, and to infrastructure improvements designed to offset the effects of climate change.
While record-low interest rates provided stimulus for home construction throughout the latter part of 2020 and 2021, inflation and higher interest rates in 2022 had had the opposite effect. Actual occupancy in office buildings remains low in early 2023, negatively affecting construction activity in major cities. Commercial and retail construction have lengthy planning and building cycles and while most projects begun pre-pandemic were ultimately brought to completion, uncertainty negatively affected the advancement of many new projects.
According to the U.S. Census Bureau, an estimated 1,649,400 housing units were authorized by building permits in 2022. This is 5.0 percent below the 2021 figure of 1,737,000. Permits trended downward throughout 2022, totaling 352,878 in the three months ended November 2022 as compared to 407,246 during the same period a year earlier. Permits peaked in March 2022 at 168,996 but had decreased to 102,461 by November 2022. Privately-Owned Housing Starts s in December 2022 were at a seasonally adjusted annual rate of 1,382,00 as compared to 1,768,000 in December 2021.
Transportation
After five consecutive years of sales in excess of 17 million light vehicles, the U.S. market shrank to 14.6 million vehicles in pandemic-plagued 2020. The seasonally adjusted annualized rate (SAAR) remained above 16 million vehicles for the first five months of the following year until the lack of computer chips limited the availability of inventory. Sales in the second half of that year were the worst in a decade, and the industry only managed to sell 15.1 million vehicles in 2021. Full year 2022 sales of light-duty vehicles ended at 13.9 million units, down 8% from 2021, and the lowest level since 2011. Sales in 2023 are currently estimated at approximately 14 million units.
After struggling for 16 consecutive months to build inventory, retail inventory finally exceeded one million vehicles in September 2022 and has increased steadily each month since. Current domestic inventory levels are nearing the 60-day supply considered ideal by industry standards
Energy
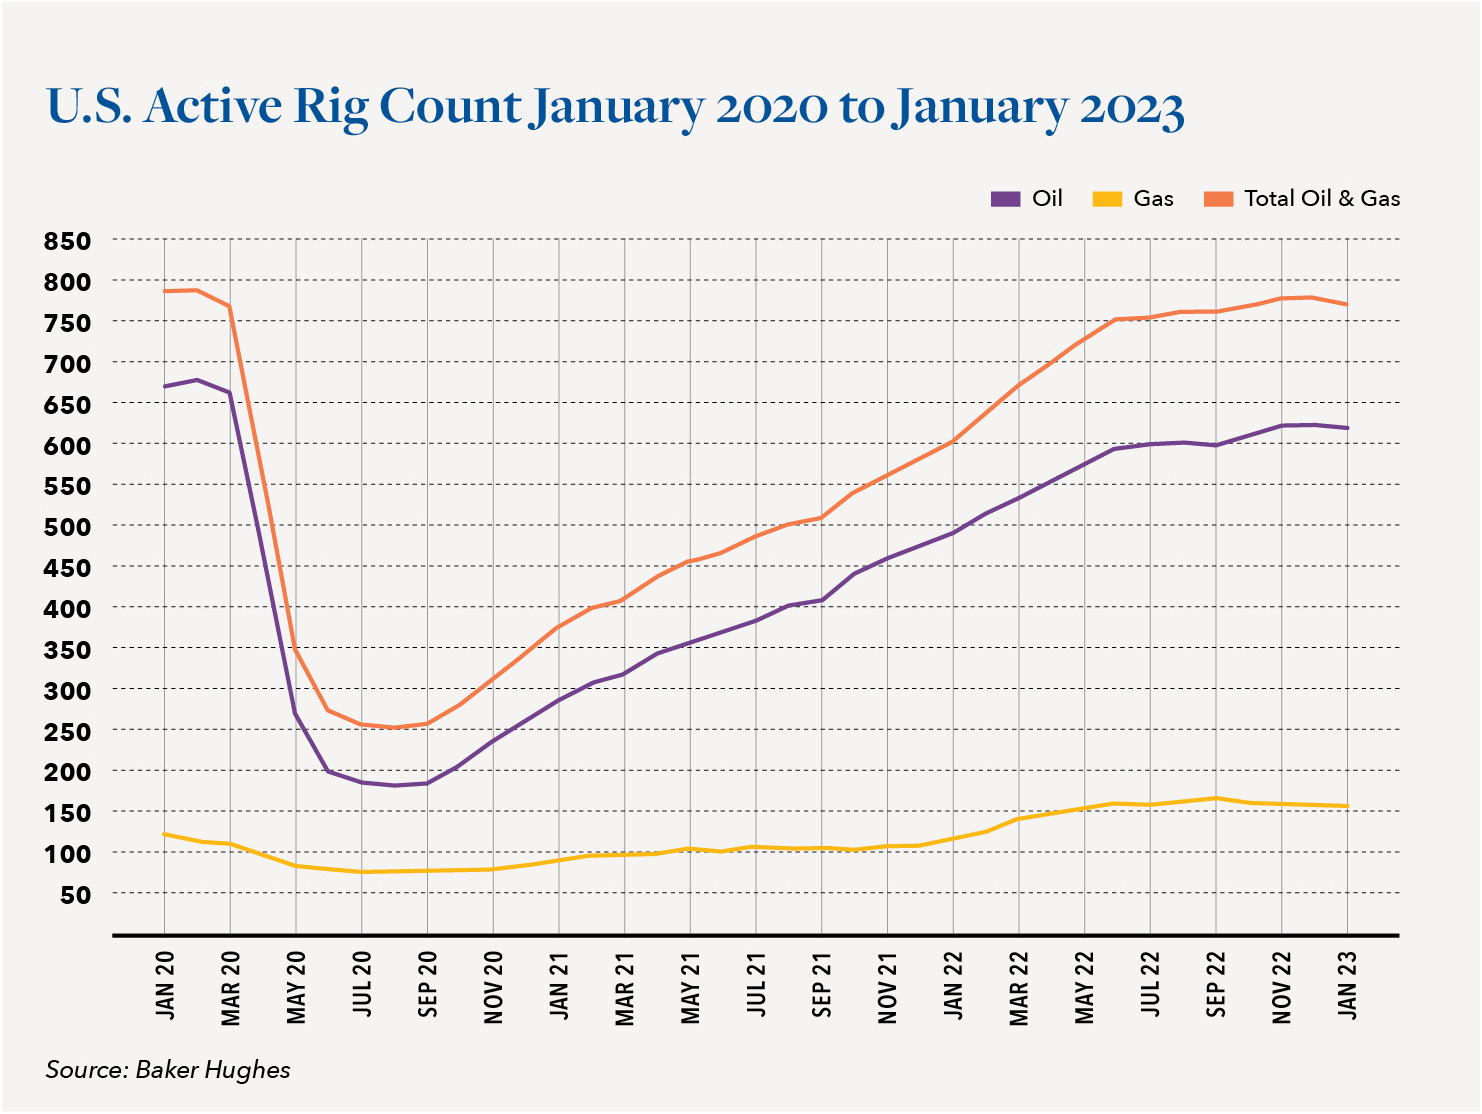
In North America the Baker Hughes Rig Count serves as a barometer for the industry as a whole, tracking the number of operational oil and gas rigs across both the U.S. and Canada. Prior to the Pandemic, in the period January 2019 to January 2020, active rigs in the two countries decreased from 1,075 to 796, dropping precipitously from there to just 250 by mid-September 2020.
As the U.S. economy expanded in the latter part of 2020 and throughout 2021, the rig count grew. Contrary to what one might believe based upon news reports, energy companies were, in fact, investing and drilling during 2022. As a result, the rig count increased with 621 active rigs in place at year end, as illustrated in the chart below.
It is important to point out that drilling a well and increasing the supply of gasoline and diesel into the market are two distinct endeavors. It might, for example, take a year to plan, design, purchase pipe and supplies, drill, and finish a land-based well to the point where gas or oil can finally be brought to the surface and tied into existing or new pipelines. Additionally, as new wells come online, older wells are also being retired from service or producing at lower rates, which offsets some portion of that new production.
For the steel industry, more drilling means increased demand for seamless pipe used in drilling applications and welded pipe used in transmission. Welded pipe is derived from hot rolled steel coils and demand for, and prices for, hot rolled coils are influenced by drilling activity.
It should also be noted that while the world searches for alternatives to fossil fuels, in the short and medium term, demand for Liquified Natural Gas (LNG) remains strong. The U.S. began exporting LNG in 2016 and by July 2022, had more LNG export capacity and more exports than any other country. According to data from the United States Energy Information Administration (EIA), U.S. LNG exports averaged 11.1 billion cubic feet per day (Bcf/d) during the first half of 2022. In fact, the availability of U.S. export LNG became a major factor in Europe’s ability to cut its dependence on Russian natural gas following the Russian invasion of Ukraine.
The most recent U.S. LNG export facility – Calcasieu Pass LNG – came on line in August 2022 and two more projects on the U.S. Gulf Coast have recently begun construction. Once completed, the export projects currently under construction will expand U.S. LNG peak export capacity by a combined 5.7 Bcf/d by 2025. Texas, Pennsylvania, Louisiana, West Virginia and Oklahoma are the biggest gas producing states and LNG exports will continue to provide demand for additional supply from facilities in those states.
Outlook
Although metals prices have decreased, we have not seen what would be classified as a classic collapse in the market and this period has enabled producers, distributors and fabricators to dispose of older higher-cost inventory and replace it with newer lower-cost product. Net Orderly Liquidation Values (NOLV’s) for metals inventory, or any inventory, tend to decrease in periods of downward trending markets and increase in upward trending markets, stabilizing when markets finally stabilize.
Most participants in the metals industry have a three- to four-month inventory including raw materials, WIP and finished goods and therefore turn their inventories in about three-months, flushing out older high cost inventory and replacing it with goods at current market prices. Most tend to run leaner in periods of downward prices, reducing risk and more quickly averaging down their inventory cost. However, this like-minded approach tends to reduce inventories throughout the supply chain whereby any real increase in demand brings about shortages and rapid market price increases. Recovery values for asset based lenders typically decrease in a downward trending market and increase in an upward trending market. Companies that run lean tend to have more consistent recovery rates, while those that have more significant inventories are more subject to risk with more volatile recovery rates.
Hilco experts work in machinery, equipment and enterprise valuation for numerous companies in the metals and mining industry and thoroughly understand the unique dynamics of price volatility on manufacturers, distributors and fabricators. We have unparalleled market trend data to assist our customers in ongoing assessment of how market forces drive recovery values. If you’re looking for a thorough process and a proven partner to help you gauge metals recovery values in your portfolio or your business, give us a call. We are here to help.


