The Evolving Story of Steel and Aluminum Tariffs

In a previous Hilco Valuation Services article from last July, we provided an early assessment of the implementation of the Section 232 tariffs on the steel and aluminum markets. In this follow-up piece, we further explore the market impact of that tariff action on the market to-date.
On March 1, 2018 the current administration announced its intention to impose a 25% tariff on steel and a 10% tariff on aluminum imports.
What goods and countries have been affected by the tariffs?
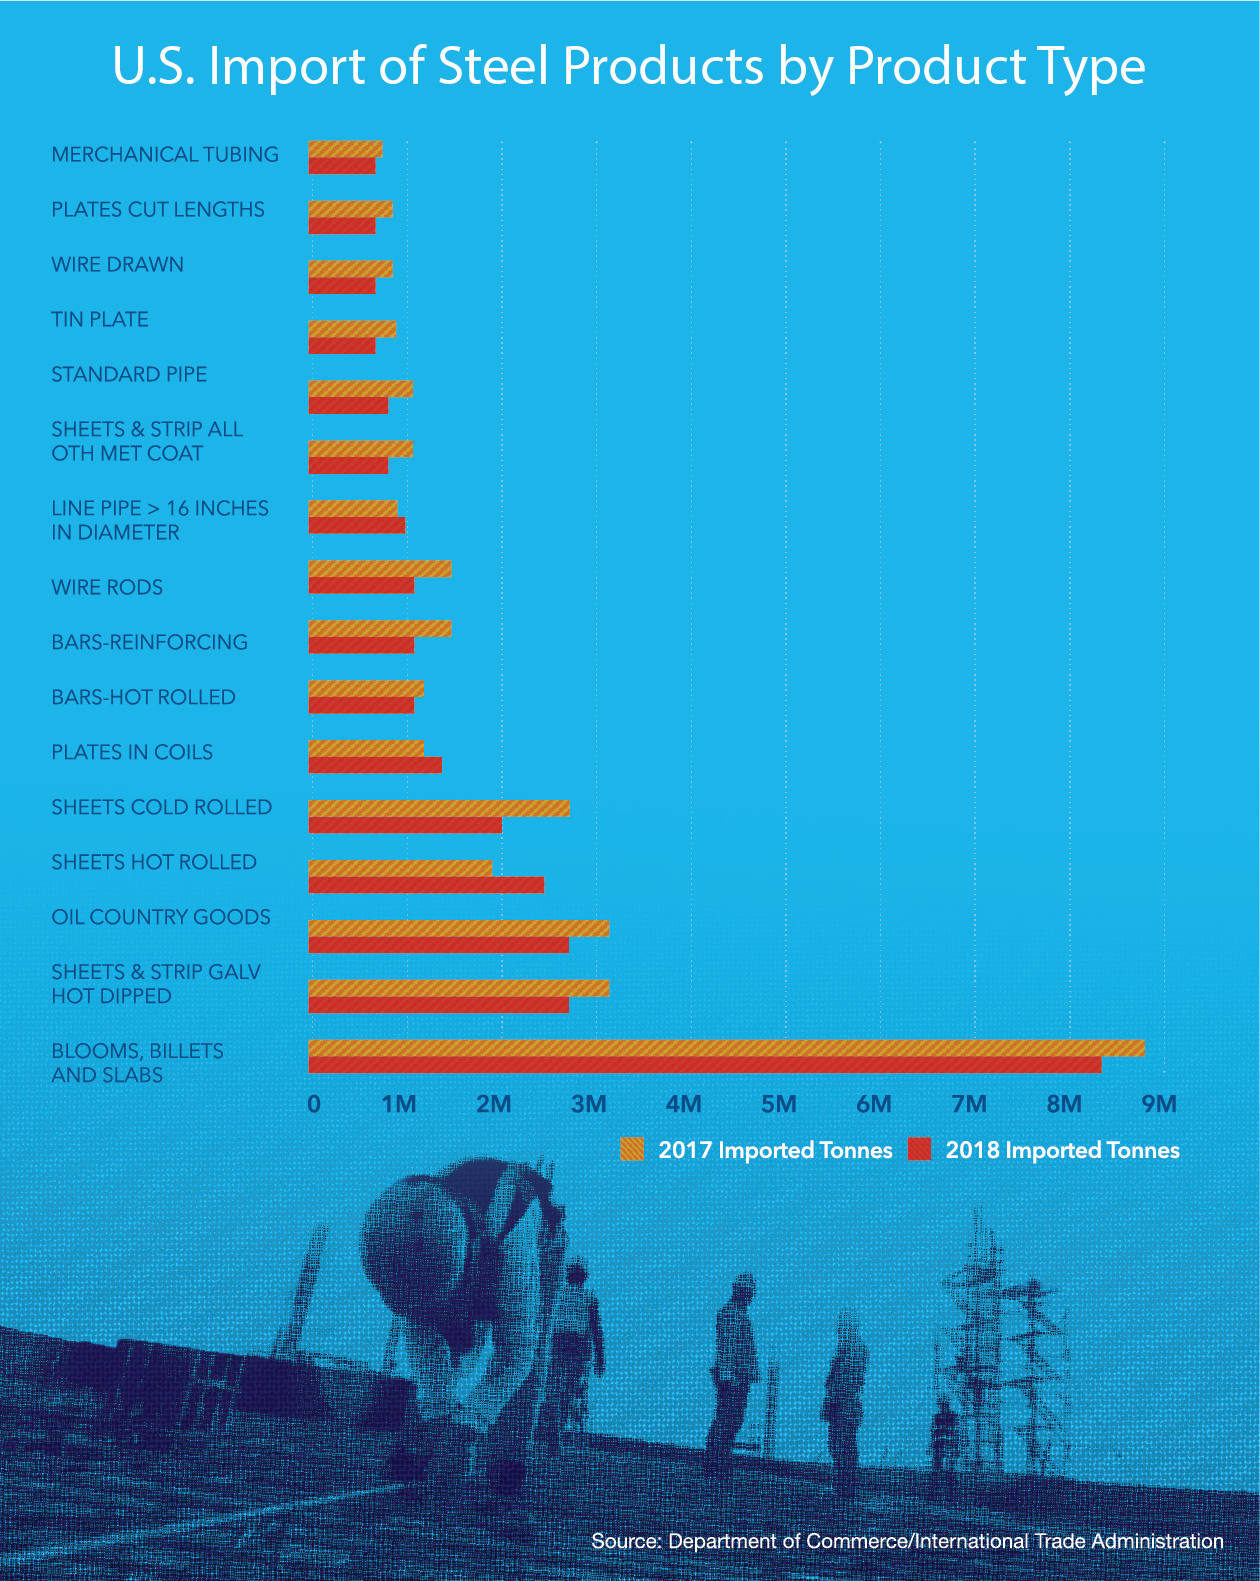
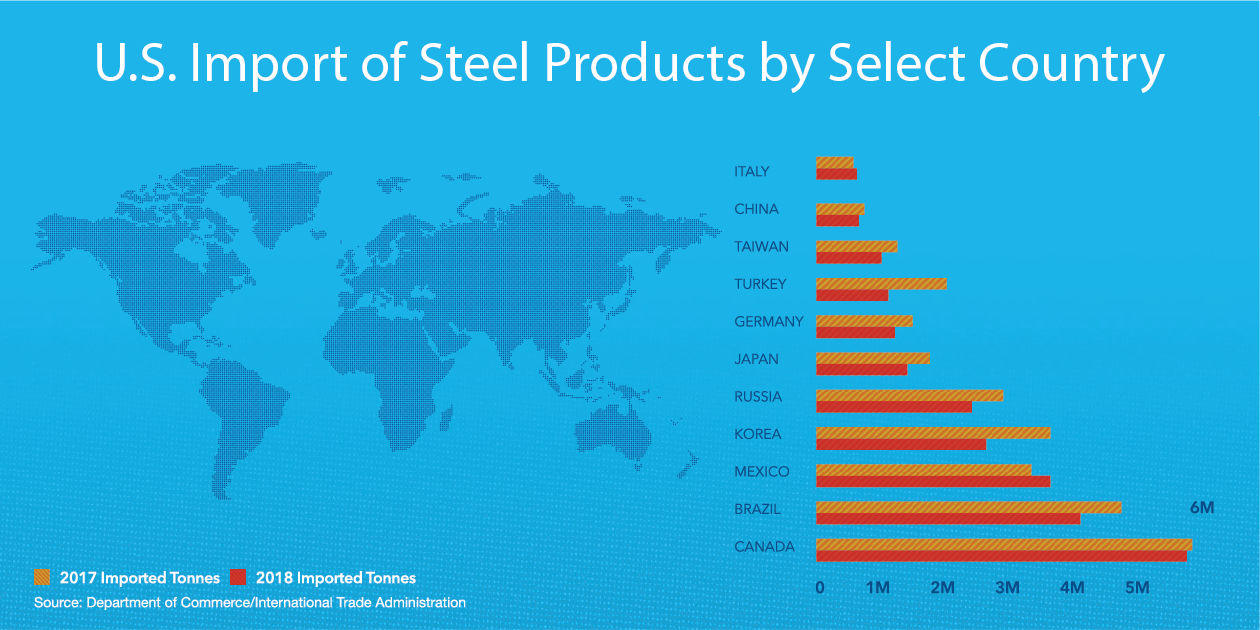
The tariffs were far reaching and applied to both semi-finished goods such as steel plate which is used for fabrication into other products, as well as finished products like steel pipe and rebar that are used as-is. The chart to the right and the chart at the top of the next page summarize major categories of steel products imported into the U.S. and major exporting countries.
The largest importers of steel products are Canada, Brazil and Mexico. China remains a major force in the export market either directly or indirectly via transshipment through other countries. In a previous Hilco Valuation Services article from last July, we provided an early assessment of the implementation of the Section 232 tariffs on the steel and aluminum markets. In this follow-up piece, we further explore the market impact of that tariff action on the market to-date.
On March 1, 2018 the current administration announced its intention to impose a 25% tariff on steel and
a 10% tariff on aluminum imports.
What goods and countries have been affected by the tariffs?
The tariffs were far reaching and applied to both semi-finished goods such as steel plate which is used for fabrication into other products, as well as finished products like steel pipe and rebar that are used as-is. The chart to the right and the chart at the top of the next page summarize major categories of steel products imported into the U.S. and major exporting countries.
The largest importers of steel products are Canada, Brazil and Mexico. China remains a major force in the export market either directly or indirectly via transshipment through other countries.
Good for who?
The Steel and Aluminum Tariffs imposed between March and May of 2018, under Section 232 of the Trade Expansion Act of 1962, were an intentionally broad sweeping step taken by President Trump and U.S. Secretary of Commerce Wilbur Ross. Trump and Ross made a determination that the existing tangled web of cyclical trade actions simply wasn’t working. Their new blanket tariff on general classes of goods would affect almost all countries, all semi-finished and certain finished product types. It would make those goods more expensive, leading domestic buyers to turn to domestic producers, who in turn would have increased demand.
The tariffs were put in place with the tacit understanding between the Trump administration and the major steel and aluminum producers that the implementation of tariffs would lead to the restart of idled facilities and job creation. Following the tariff implementation, U.S. Steel Corporation restarted two blast furnaces at its Granite City, Illinois facility. Century Aluminum restarted certain equipment at its facilities. Other producers, both large and small, have also activated idle equipment and facilities, or expanded production at existing facilities.
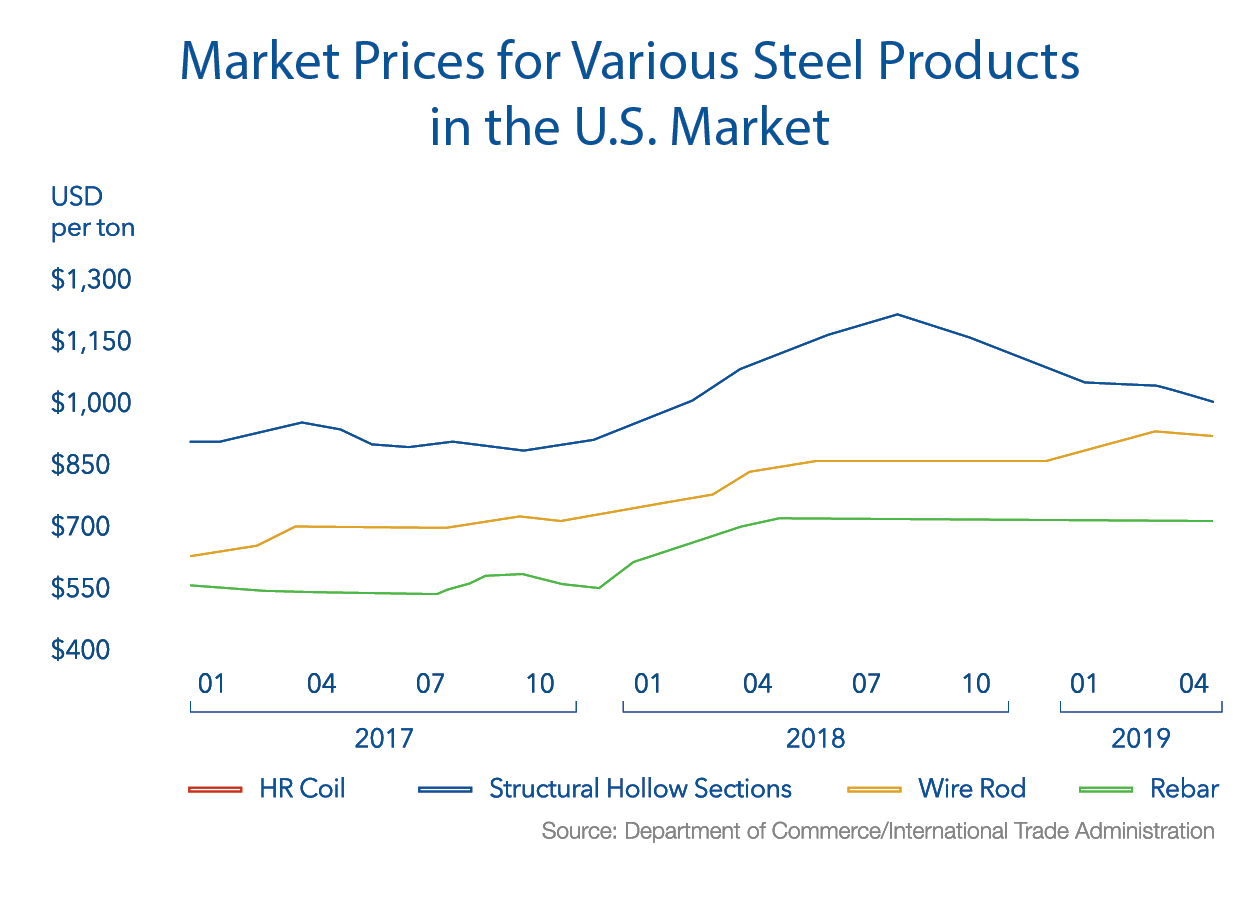
The tariffs both reduced the quantity of steel and aluminum goods brought into the U.S. and made them more expensive, allowing domestic producers to expand output and increase sell prices. As illustrated in the chart below, domestic market prices for most steel product types increased in the first and second quarters
of 2018 and then stabilized or decreased.
Market prices for steel coils, which are typically more volatile than those of other product types increased more than 30% in the months following the tariff announcement. As domestic output increased, price competition also increased. Market prices peaked in the June-July 2018 period and then slowly decreased. As of April 2019, market prices for steel coils were typically at or below pre-tariff levels.
While benefiting the steel and aluminum industries and suppliers to those industries, the tariffs have also made steel and aluminum more expensive. As a result, this has made construction and domestically produced vehicles, appliances, consumer and industrial goods more expensive. Many domestic producers and participants in the production and distribution chains have made it clear that they believe a system of import quotas, rather than tariffs, would be more effective in the long run. Quotas would restrict the quantity of goods that foreign producers or countries could ship into the U.S., potentially providing increased market stability and decreasing the incentive to undercut domestic market pricing.
Why the previous approach to trade sanctions was deemed insufficient?
Over the last 10 to 15 years, foreign manufacturers including to great extent the Chinese have been highly successful in offloading excess steel and aluminum products – both semi-finished products like rebar and steel plate and finished products including steel tubes or fasteners – into the US and other markets.
This clearly has had the impact of driving down prices for these goods and putting stress on our own domestic manufacturing and distribution engine. Even when not directly selling goods into the U.S., Chinese producers do so indirectly by a) selling coils to neighboring countries where they are converted into pipe that is then exported to the U.S.; or b) flooding other countries with Chinese goods such that coil producers in Australia and elsewhere then seek to export their products into the U.S. Other countries like Brazil and Russia
Fearing circumvention, tariffs were ultimately applied to both Mexico and Canada and remained in effect until May 17, 2019 when the President announced that they would be rescinded as part of the larger U.S.M.CA agreement. The targeted elimination of these specific tariffs reinforces the unpredictability of tariff efforts, in general, and adds a level of uncertainty to market participants.
import semi-finished goods including slabs that are converted into coils and plates, and billets that are converted into “long” products like beams and bars in the U.S. These lower cost, imported semi-finished goods typically provides a cost advantage to importers that compete with U.S. producers using domestically produced slabs or billets.
As this has occurred, domestic manufacturers and interests have understandably reacted by notifying the Office of the U.S. Trade Representative (USTR) and the World Trade Organization (WTO) of the activity, in each case seeking to trigger some sort of punitive measure of tariff as a result.
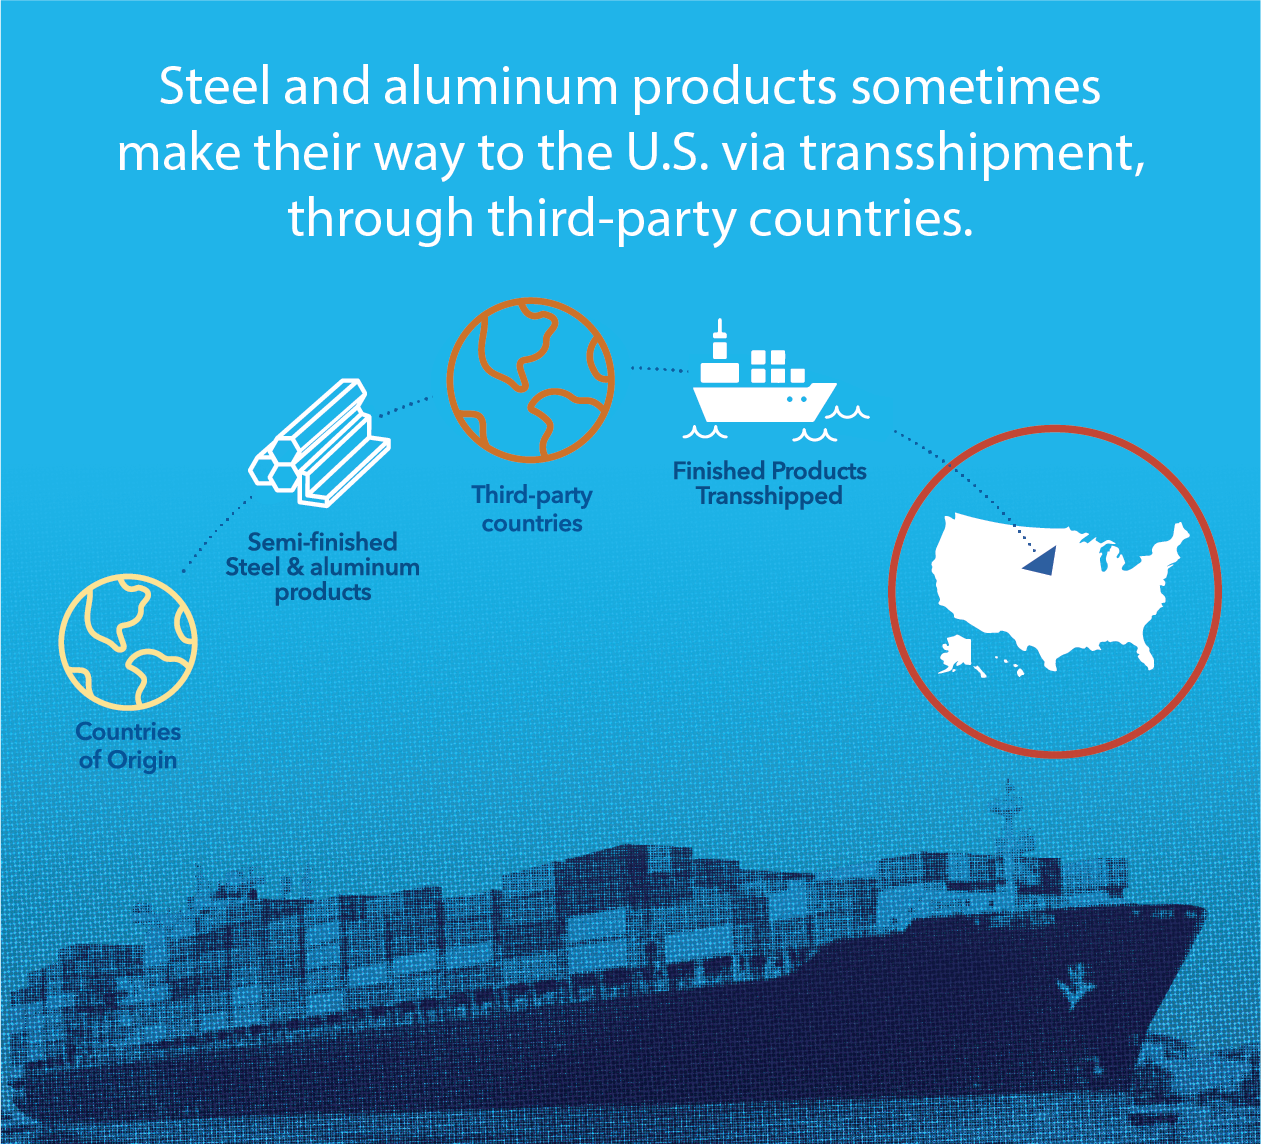
And indeed, after some period of time during which a competitive advantage was gained by the exporters, resulting tariffs have been imposed on the import of some specific categories of products. In certain cases, these tariffs or measures have even been retroactive in nature, designed in an effort to claw back losses incurred over the prior period.
But just as quickly as these deterrent measures have been implemented and enforced on one metal or aluminum product category or type, exporters as a group have been able to nimbly shift focus to another. And when a new tariff is imposed after months or years of that, they have refocused again, essentially circumventing the system.
Case in point: In 2015, the U.S. placed tariffs on Chinese cold rolled and galvanized coils and then observed a notable increase in output and export of the same sorts of goods from Vietnam. The tariffs were circumvented by Chinese producers who shipped semi-finished steel coils to Vietnam and elsewhere. These items were then processed to completion in those countries and later transshipped to the U.S. During 2015, cold-rolled steel shipments to the United States from Vietnam increased dramatically to $215 million from $9 million annually following the imposition of anti-dumping duties on Chinese steel products. During the same period, imports of corrosion-resistant steel rose to $80 million from $2 million. In mid-2018, finding that its anti-dumping and anti-subsidy orders had been purposefully evaded, the U.S. Commerce Department imposed significant duties on steel products originating in China but being shipped into the U.S. from Vietnam.
Based upon data from the International Trade Administration / U.S. Department of Commerce, individual actions such as those against Vietnam as well as the broader 232 Tariffs have had a notable impact. From 2017 to 2018, U.S. quantity of imports decreased from 8 of the United States’ top 10 import sources. The overall value of U.S. imports increased from 5 of the top 10 sources. The value of imports from Vietnam increased the most in 2018 (59%), followed by Mexico (20%), Canada (8%), Brazil (6%) and Germany (6%).
Exporting unemployment
In the case of the Chinese in particular, trade advantage is often initially gained through the forced technology transfer, patented processes and products, and the associated absence of true R&D cost. Low labor expense enables cheap production, and the ability to sell into global markets at a discounted price point seals the trade advantage.
Perhaps most important to understand is that the Chinese are essentially exporting unemployment. They ramp up and put their people and idle machinery to work. The pain is then transferred to markets like the U.S., where the equivalent domestically-produced goods lose market share, which in turn results in excess manufacturing capacity, shuttered facilities and unemployed workers.
The inner workings of the system
The Chinese, as do the Japanese and various others, tend to sell through trading companies. A Chinese producer may for example contract with one or more of those trading companies to move semi-finished steel or aluminum capacity over a specific period of time. Those companies, in turn, fan out to their contacts in the US. to sell 300 tons to one buyer, 400 tons to another until they create a full shipload. Buyers of record could be importers or specific manufacturers or distributors. It’s this web of interconnected people engaged in the selling, purchase and distribution of products for the lowest cost that at time creates the justification for measures such as tariffs.
Are U.S. Buyers complicit?
Let’s take the case of a theoretical manufacturer of building products in Michigan who is quoted $200 less per ton by a company in a neighboring state for the partially assembled materials he needs to produce his goods. That manufacturer may believe that he is buying U.S. produced steel or aluminum, while in reality the substrate used to produce those goods was originally manufactured overseas and bought through a U.S. broker working with a foreign Trading Company. Is this buyer aware of the product’s origin? Perhaps. And, if so, is it really that surprising? After all, he is likely comfortable with his purchase because the steel is of a sufficient quality for his use, while the associated cost savings he experiences buying through this path enables him to achieve the margins needed to stay competitive in the market.
The realities of rule 232 in action
To a great extent, the informal agreements between the Trump administration and the steel and aluminum producers in 2018 have proven true. As the tariffs have taken effect, they have succeeded in making foreign goods more expensive, enabling domestic steel producers to raise their prices incrementally to a level that still provided a market advantage. Mills have re-opened, employees have been re-hired and utilization has been increased. As expected, domestic output to-date has increased on both aluminum and steel.
While they have helped U.S. steel and aluminum producers to regain momentum and competitiveness, part of the goal of the 232 tariffs was to deter subsidized Chinese production; and that has not been as effective. There is also growing concern by the administration over the increasing practice of transshipment of Chinese metals through Vietnam and other third party Asian countries. The potential also exists for countries such as South Korea to focus-in more on the U.S. market directly or indirectly as China branches out to dispose of its surplus in markets where South Korea has enjoyed some level of dominance and high profitability over the past several years. Furthermore, the tariffs have worked, but
In some ways, the policy has favored steel manufacturers and workers at the expense of the general public.
not equally for all parties. Take, for example, automotive manufacturers who are heavily steel, and increasingly aluminum-reliant. Current market conditions do not enable these increased costs to be passed along directly to consumers in the form of vehicle sticker price increases. While buying U.S. steel and aluminum at incrementally higher cost and supporting the US economy, they have not been able to truly benefit from a profitability perspective. And overall, the U.S. domestic consumer suffers a bit too because things like the doors for the storage units they rent and the garage doors they need to replace in their homes go up in cost as well. So, in some ways the policy has favored steel manufacturers and workers at the expense of the general public. But overall, the U.S. is producing more tonnage, more people are working, eating out at restaurants with their families and building the economy.
What does the future hold?
At some point in the next two- to six-years, the current administration policies will likely be rescinded or changed. Until then, lenders will no doubt want to keep a close eye on their metals industry portfolios with an emphasis on assessing performance and risk.
Hilco Valuation Services operates deeply within the steel and aluminum markets. We thoroughly understand the unique dynamics of price volatility on manufacturing and distributor inventory types and we have unparalleled market trend data to assist our customers in ongoing assessment of how market forces drive recovery values. If you’re looking for a thorough process and a proven partner to help you gauge metals recovery values in your portfolio or your business, give us a call.


